PROJECT DETAIL
GreenToBuy-ML
An ML-powered app that predicts product and stock trends, with real-time dashboards via a Streamlit interface.
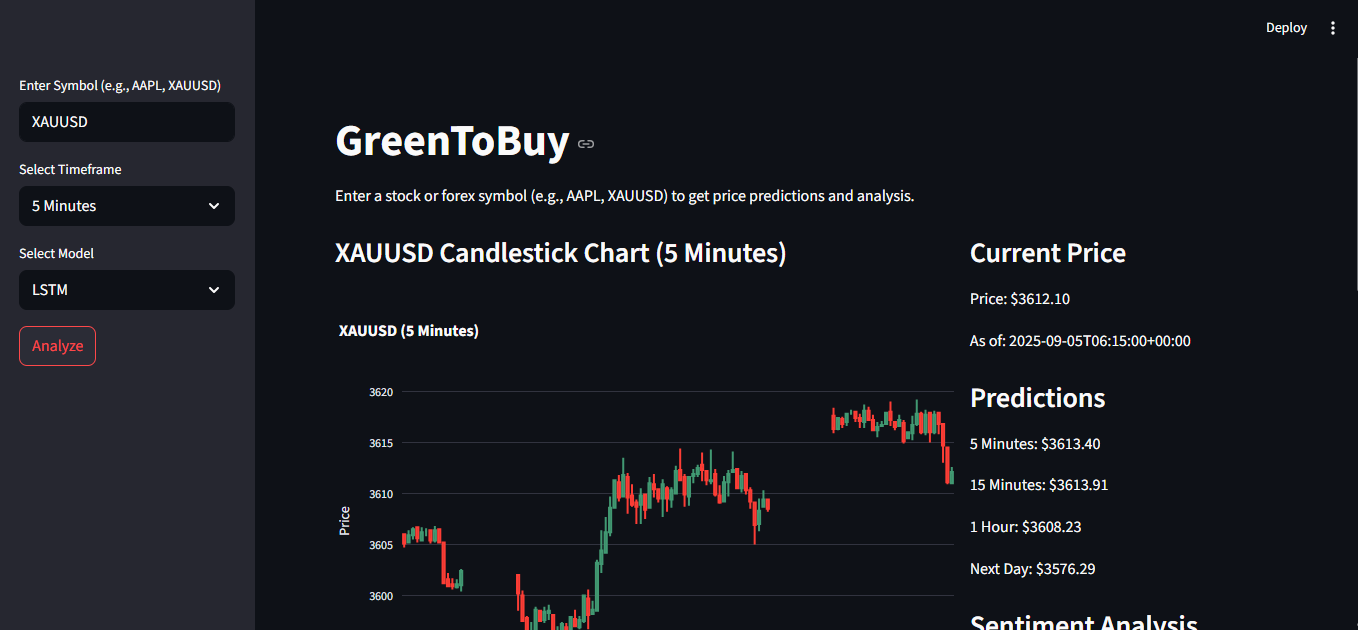
Project Overview
In this project, i implemented a machine learning application that predicts stock prices and provides real-time analysis. The aim is to combine the power of data science with financial market insights, making it easier for users to understand stock trends and patterns.
The application is built with Python and powered by Streamlit to create a simple, interactive web interface. By entering a stock symbol, users can quickly analyze past performance, view predictive charts, and compare results across different machine learning models like Linear Regression, Random Forest, and Gradient Boosting.
Unlike typical static prediction tools, this project integrates real-time financial data from APIs, ensuring that the analysis remains relevant and up to date. The focus is not only on delivering accurate predictions but also on providing clear visualizations and an educational platform for understanding how ML techniques apply to finance.
At its core, GreenToBuy-ML is designed to bridge the gap between machine learning and practical stock market analysis, while also highlighting that predictions are for learning purposes only—not financial advice.
Technology Stack
- Python → Core programming language
- Streamlit → Web application framework
- Scikit-learn → Machine learning algorithms
- TensorFlow → Deep learning support
- Matplotlib / Seaborn → Data visualization
Machine Learning Models
- Linear Regression – fast and easy to interpret
- Random Forest – handles non-linear trends and minimizes overfitting
- Gradient Boosting – excels at recognizing complex patterns with high predictive accuracy
Features
- Trend Prediction: Forecast stock or product movements using Linear Regression, Random Forest, and Gradient Boosting.
- Interactive Dashboard: Use Streamlit to explore models, predictions, and visualizations in real time.
- Customizable Analysis: Input your choice of stock symbol (e.g., AAPL, TSLA) and select time frames for tailored forecasts.
- Rich Visuals: Includes trend graphs, comparison charts, and error distribution plots.
- Modular Backend: API support with FastAPI (optional) for deployment-ready separation.
APIs Used:
- Alpha Vantage (
ALPHA_VANTAGE_KEY) - Finnhub (
FINNHUB_API_KEY) - Twelve Data (
TWELVE_DATA_API_KEY) - NewsAPI (
NEWSAPI_KEY)